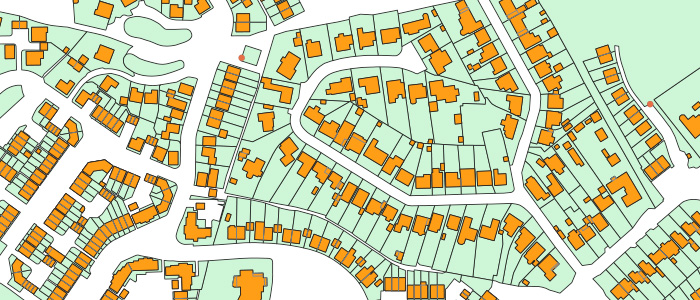
Small Scale Maps
A small-scale map cover large regions, such as world maps, continents or large nations. In other words, they show large areas of land on a small space. They are called small scale because the representative fraction is relatively small.
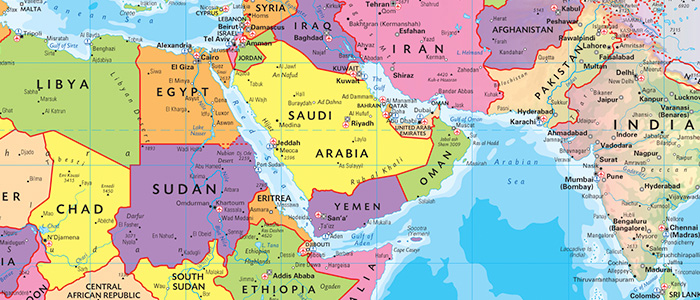
Large Scale Maps
Large-scale maps show smaller areas in more detail, such as county maps or town plans might. Such maps are called large scale because the representative fraction is relatively large.
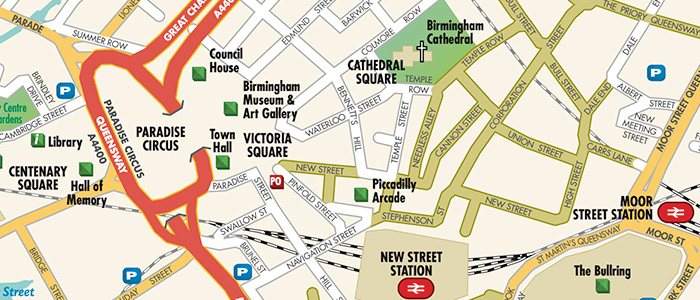
Topographic, Physical, or Relief Maps
These maps depict general landscape features, illustrating terrain through hillshading, hypsometric tints, or contours.
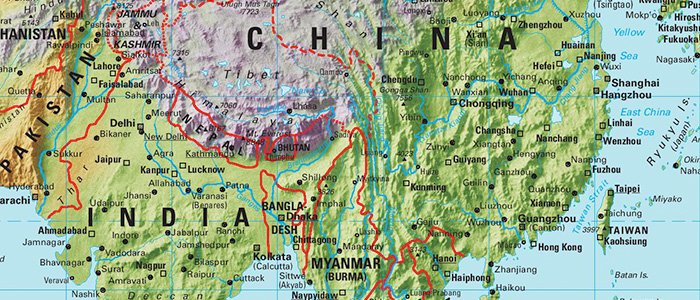
Schematic Mapping
Schematic mapping uses simplified, abstract representations with symbols and lines to convey essential information about a system or network, omitting non-essential details for clarity.

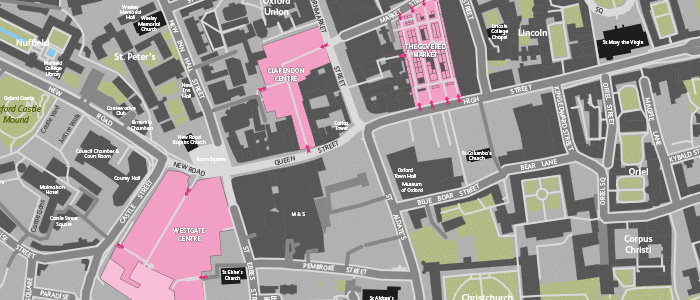
Transport, Road, or Street Maps
Designed to detail transportation networks, these maps are essential for navigation and urban planning.
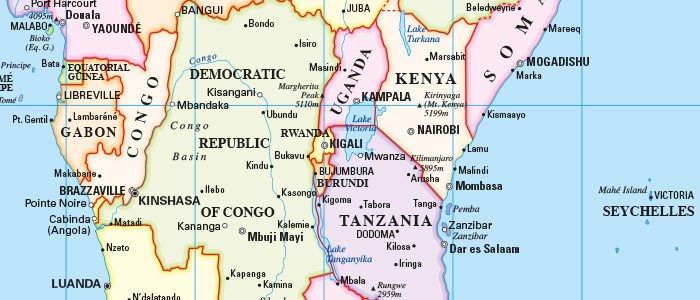
Political Mapping
These maps use colors to differentiate countries or regions, emphasizing political boundaries and major cities.
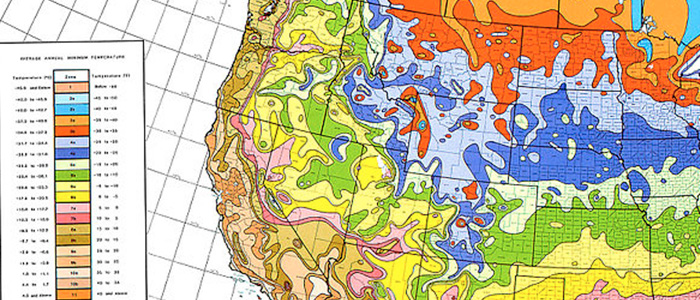
Thematic Mapping
Focusing on specific themes or data sets, thematic maps highlight particular features or patterns.
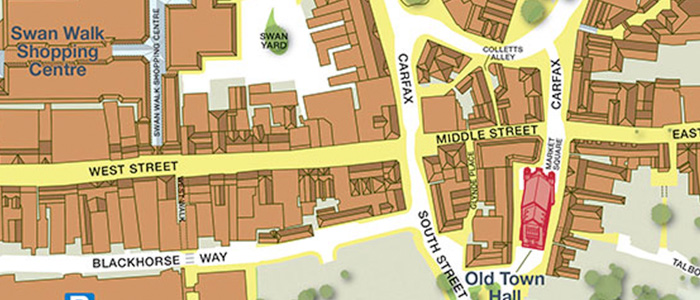
Illustrated or Pictorial Mapping
Utilizing illustrations and graphics, these maps convey information in an engaging manner, often for tourism.
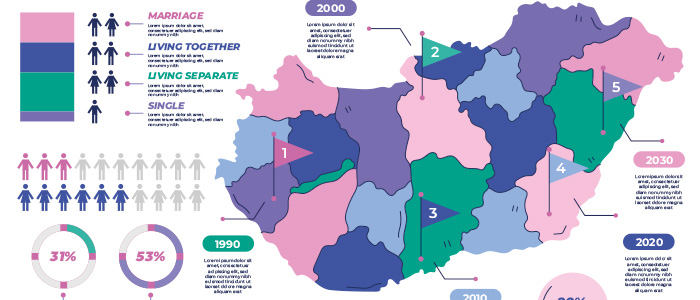
Infographics
Combining maps with charts and imagery, infographics present complex data clearly and informatively.
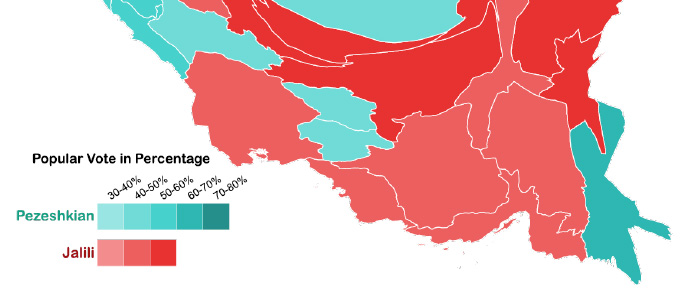
Cartogram
Intentionally distorting geographic areas, cartograms represent data such as population size by resizing regions accordingly.
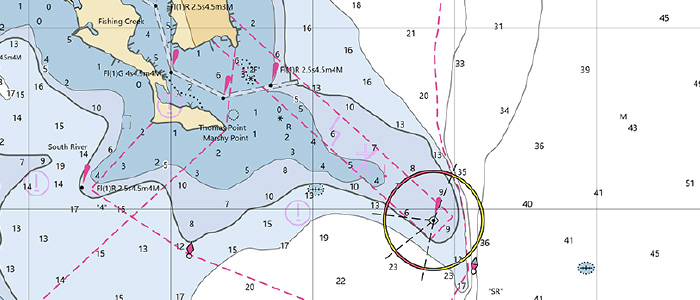
Charts – Hydrographic and Aeronautical
Specialized maps for maritime and aviation purposes, focusing on navigation details like shipping channels and flight corridors.
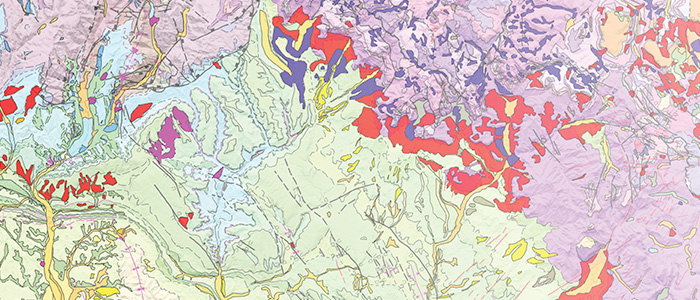
Geological Maps
These maps display soil and rock types, crucial for industries like oil, gas, and mineral extraction.
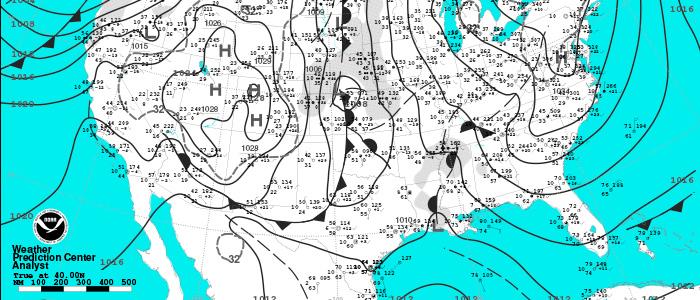
Climatic and Weather Maps
Designed to show weather patterns, these maps often use generalized geographic areas or satellite imagery.
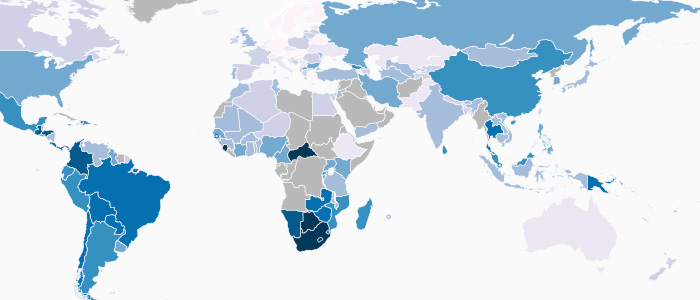
Choropleth and Isopleth Maps
Using shading and patterns, these maps indicate changing data patterns, with colors representing different densities.
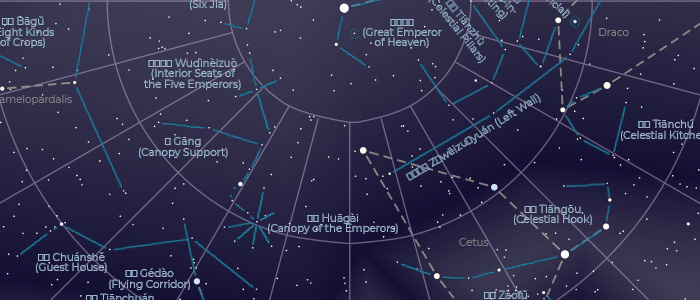
Star Charts
Maps of the sky that show the positions of constellations and celestial bodies.
Cadastral Maps
Providing accurate measures of land quantities, values, and ownership, these maps are essential for property management.
